View User Metrics
As an organisation or foundation admin, you can monitor your users’ activity, including request volumes and performance, directly from the Spectrum dashboard.
Step 1: Log in to Your Dashboard
- Visit: dashboard.spectrumnodes.com
- Enter your user credentials if logged out.
Step 2: Navigate to Shared Access
- In the left sidebar, you should see a Shared Access tab.
- If you do not see the Shared Access tab, you may need to upgrade your account to access this feature.
Step 3: Go to Metrics
- Inside the Shared Access panel, select the Metrics tab.
- You’ll see a list of all users connected to your organisation or foundation.
Step 4: Adjust the View
- Use the view selector to switch between:
- Users/Projects: View metrics by individual users (or projects if a specific user is selected).
- Network: View metrics by blockchain network.
- Method: View metrics by RPC method.
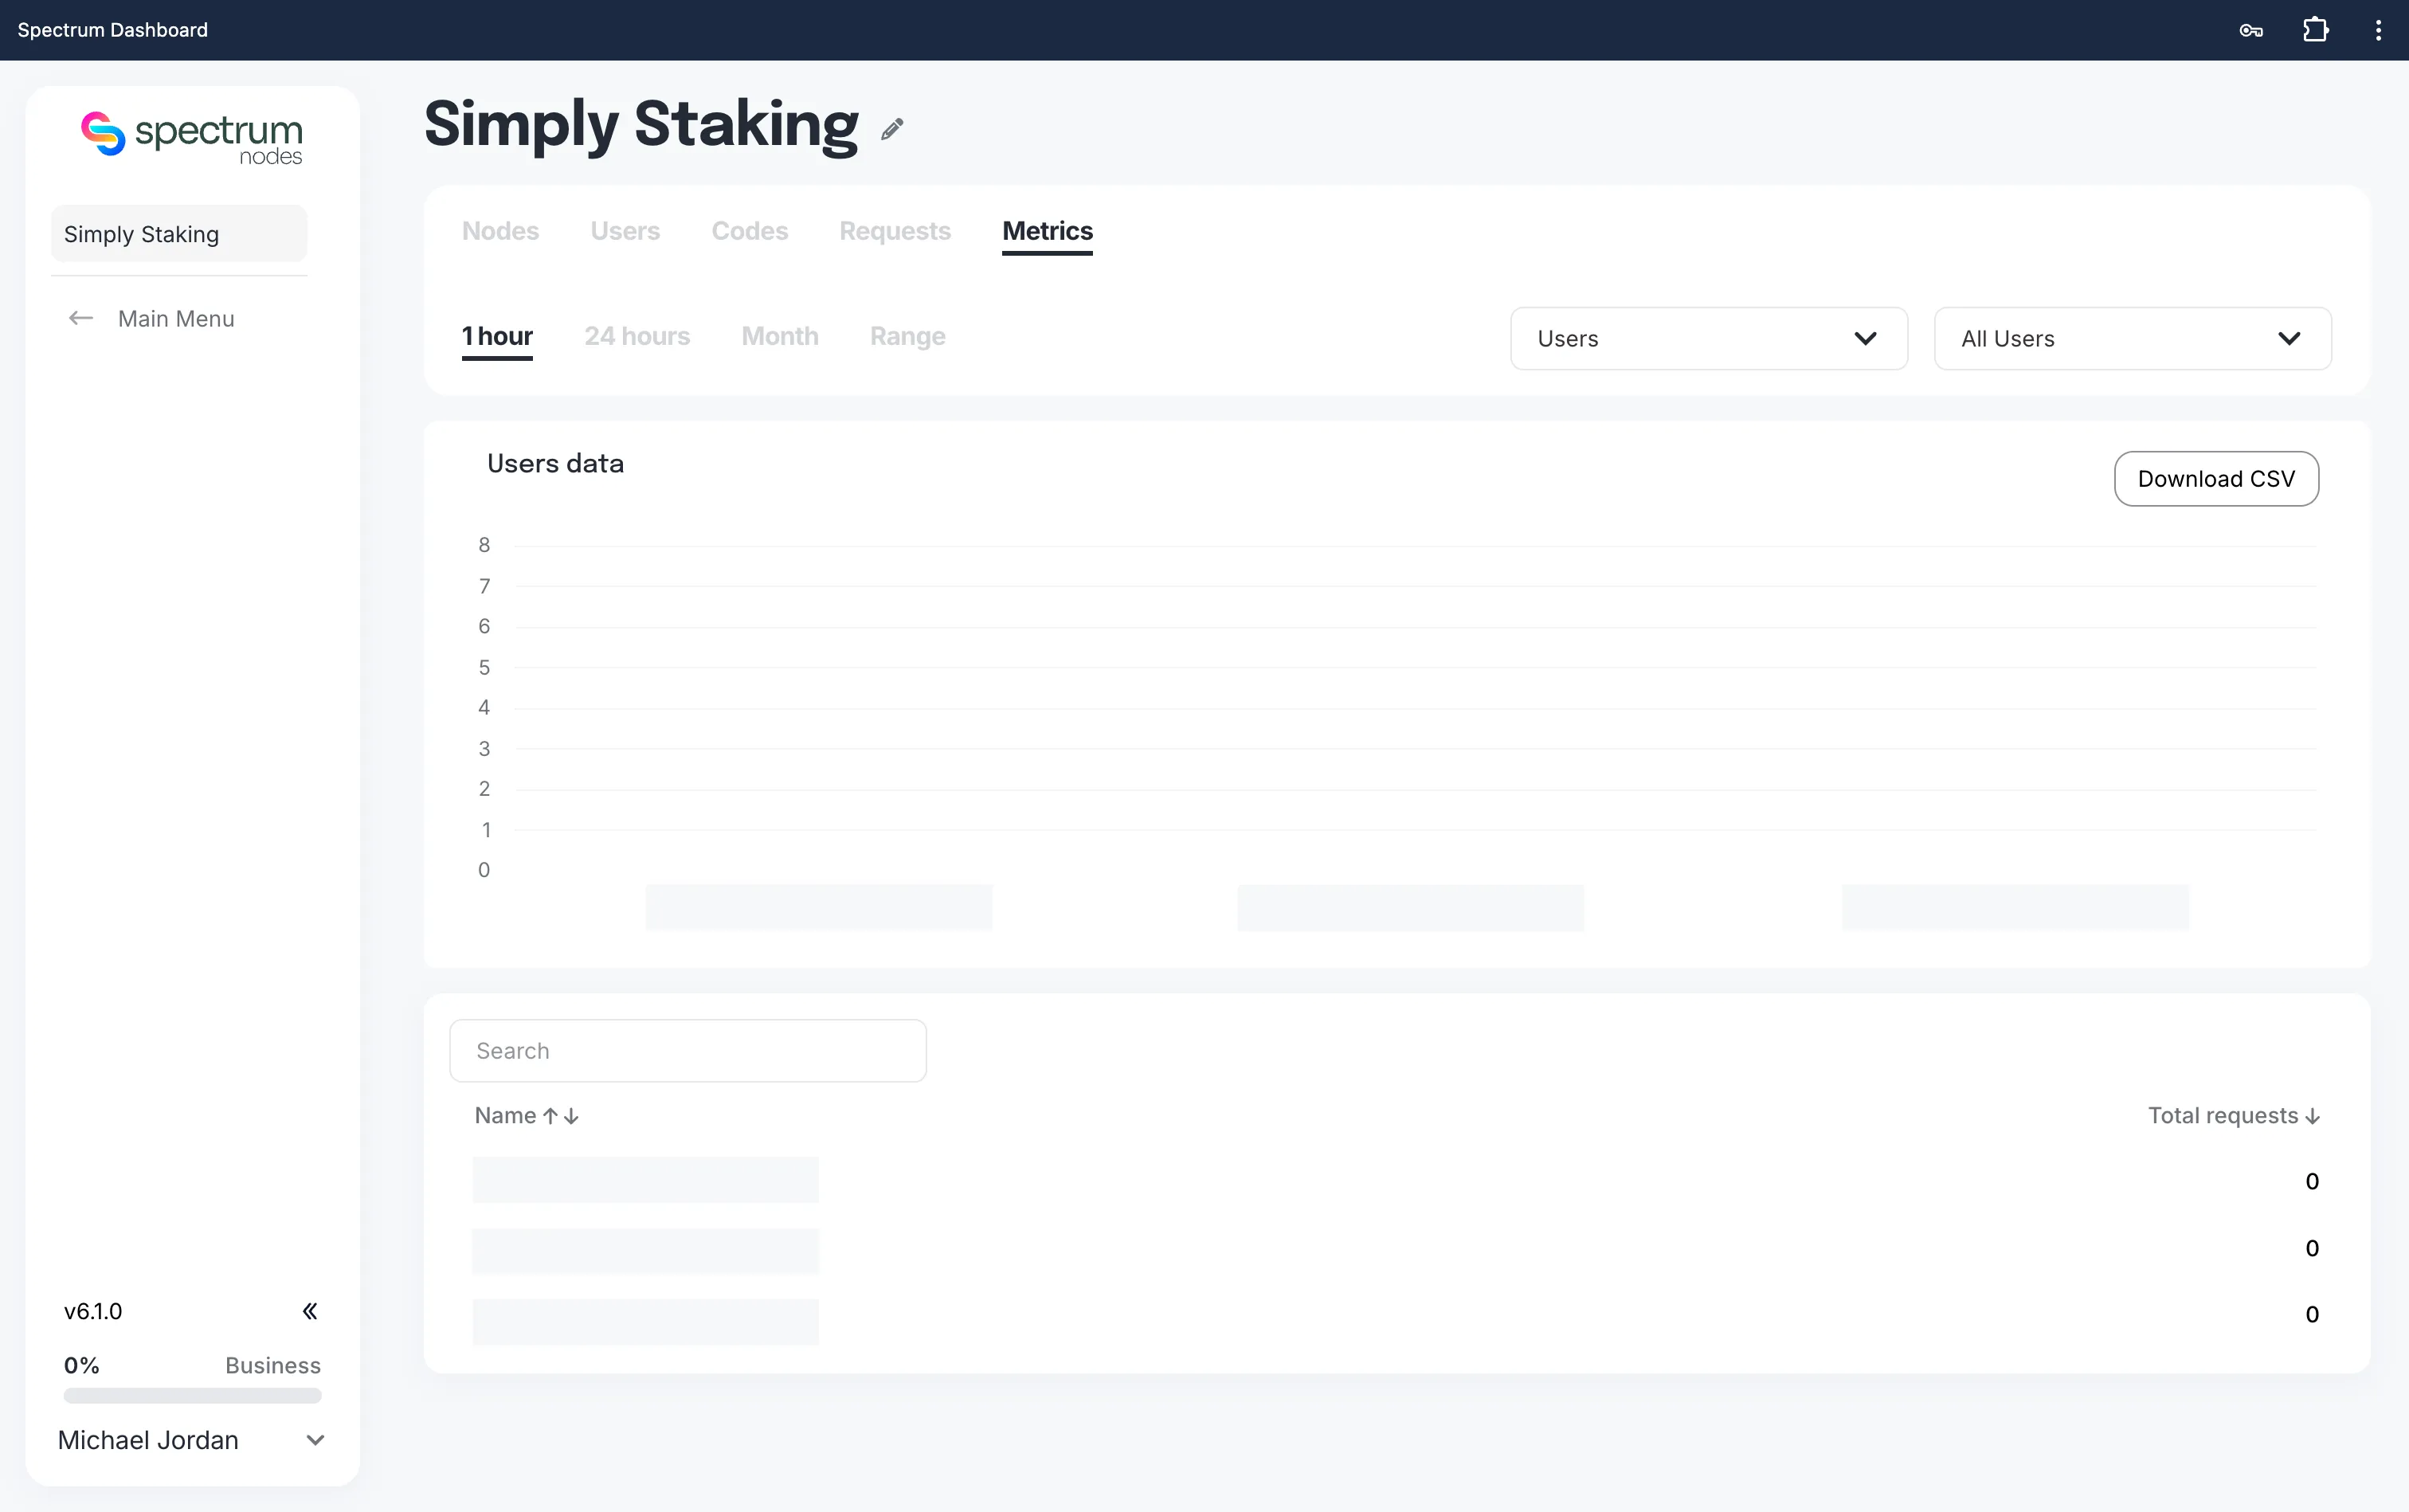
- Use the time range filters (1 hour, 24 hours, Month, or Range) to choose the period you want to review.
- Optionally, use the All Users dropdown to filter metrics for a specific user.
Step 5: Read the Metrics
- Hover over any data point to see the exact number of requests.
- Click Download CSV to export the data for offline analysis or reporting.
Regularly reviewing user metrics can help you identify unusual spikes, optimise resource allocation, and ensure fair usage across your organisation.